Home
Industrial systems
MES · Manufacturing execution QMS · Quality management SCADA · Data acquisition WMS · Warehouse management
Data visualization
BI dashboards
Applied AI
AI visual inspection AI short drama AI avatars
Services & company
Custom engineering Implementation About us Contact Book a demo
Data visualization · BI dashboards

BI dashboards
2D for numbers, 3D for the floor

ERP holds the orders, MES the work orders, QMS the inspection records — but whether a machine is running and where the line has got to is still only visible on the floor. The BI dashboard is 2D: system data turned into charts. The digital twin is 3D: plant, lines and machines rebuilt with their live status.

05 — DASHBOARD

One screen, two dimensions

The BI dashboard is 2D: KPI cards, trends, rankings and heat maps spread the business and production numbers across the screen and answer how today is going. The digital twin is 3D: plant, lines and machines are modelled where they really sit, with status, alarms and material flow pinned back in place, answering what is happening on the floor right now.

  • KPI frameworkTurn vague words like output and yield into a definition, dimensions, an owner and a source
  • Multiple sourcesDirect reads from ERP / MES / QMS / SCADA databases and APIs, plus Excel — without touching the source systems
  • Live and scheduledKey metrics at second resolution, management metrics by shift; local buffering through an outage, back-filled on reconnect
  • Screen fittingVideo walls, LED, meeting displays and phones share one configuration, so a new resolution needs no rebuild
  • Roles and rotationDifferent pages per role, auto rotation when unattended, remote page switching and ad-hoc inserts
  • On-premiseFront end, services and database all in your server room; production data never leaves the network
Two forms2D data wall / 3D twin wall
One wallEvery plant KPI in one place
100%Data stays in your network
Which one

One for the numbers, one for the floor

The BI dashboard is 2D and tells you the result; the digital twin is 3D and shows you the state. Most companies start with 2D to settle definitions and data flow, then move to 3D as needed.

NO.01Good first step

BI dashboards

Mostly 2D. Output, attainment, yield, OEE, energy and inventory turns on one screen: how much was made today and which line is dragging, in a single glance. It goes live as soon as there is a data source, and it is the first screen most plants build.

What it showsData: output, attainment, yield, OEE, energy, inventory turns
ShowsKPI cards, trends, rankings and heat maps, all 2D
Where it goesControl centre, meeting rooms, shift-start boards, the MD office
How it is usedAuto rotation; click a KPI to drill into line and work order detail
NeedsData from your systems, or an Excel file worth looking at
2D chartsStart as soon as there is data2K / 4K video wall
NO.02Immersive

Digital twin

Mostly 3D. Plant, workshops and lines modelled to real scale and layout, with machine status, position, AGV paths, alarms and energy pinned onto the model. Every machine on the screen is the one on the floor.

What it showsFloor: machine status, position, material paths, alarm pins, energy heat
Shows3D plant, line and machine models rebuilt to the real layout
Where it goesLobby tours, remote operations centre, group HQ, plant openings
How it is usedRotate and zoom; click a machine for parameters, work orders and live video
NeedsAsset register, tag list and plant drawings (BIM or CAD preferred)
3D scenesNeeds a 3D model firstVideo and fly-through
Screen preview · BI dashboard

KPIs, trends and rankings, told on one screen

The wall is all 2D: four KPI cards on top give the verdict, the trend in the middle shows whether you are drifting off plan, and the ranking on the right names the line. A ticker runs along the bottom for unattended shifts.

BI dashboard (2D): KPI cards, trends, rankings and a scrolling ticker — all 2D charts, made for a meeting room or a control centre wall.

Screen preview · Digital twin

Machine status, floating on the model

The 3D plant sits on the left, with machines, lines and material placed where they really are and status shown by colour and motion; the machine list and live alarms sit on the right, and any machine opens its parameters, work orders and video.

Digital twin (3D): the 3D plant matches real positions one to one, machine status floats on the model, and a click drills into parameters, work orders and video.

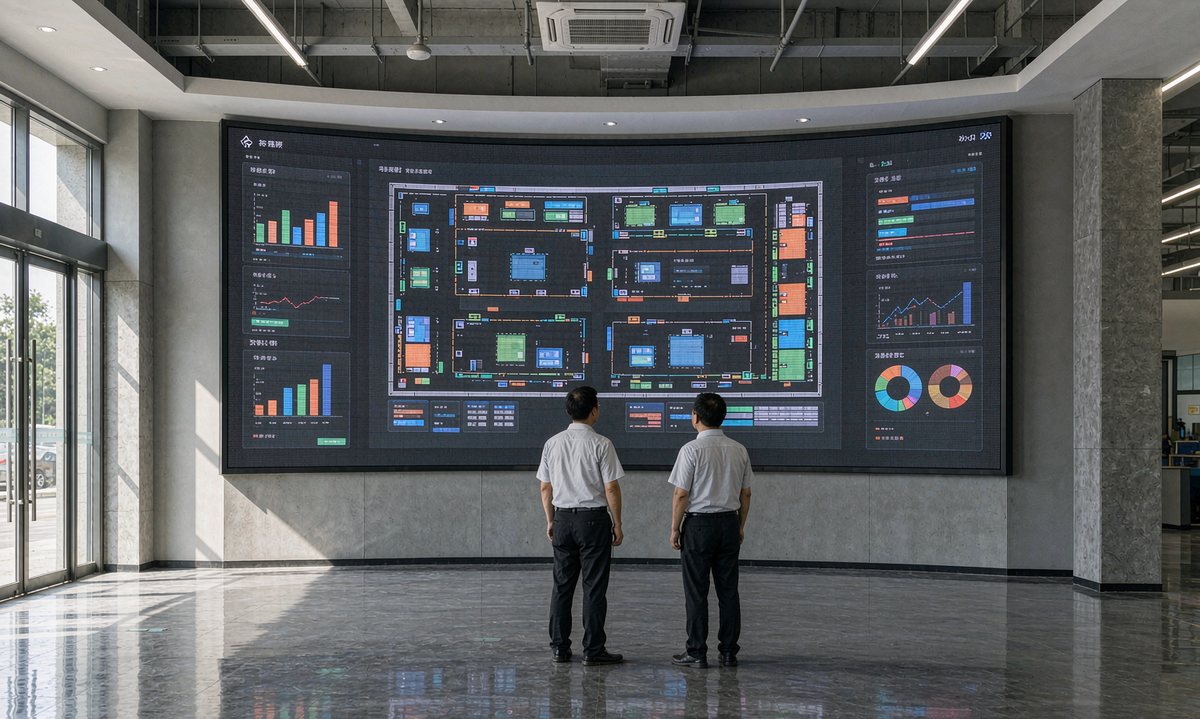
A plant floor plan and line status across the lobby screen, two people standing in front of it
The plant, laid out on one screenStatus, alarms and work orders all sit on the machine they belong to — one click drills in.

Illustrative render · AI-generated

Delivery steps

Four steps to a working wall

Dashboard projects rarely fail on technology; they fail because the metrics were never pinned down. We work in four steps, each with something you can confirm.

01

KPI definition

Output · KPI definition sheet

Business and IT decide together: who looks at it, what they look at, how each number is calculated. The result is a KPI definition sheet that everything else is built against.

02

Data connections

Output · Data flowing

Direct database reads, API connections and Excel collection are handled separately. Get one main chain working, then fill in the rest.

03

Interface and interaction

Output · Dashboard design

Design first, so layout and colour are agreed before build. Viewing distance and type size on a wall follow very different rules from a web page.

04

Go-live and hand-holding

Output · On-site tuning

We tune screen, resolution and refresh rate on site, then adjust definitions and page order to how people actually use it.

Where it fits

2D and 3D, each plays to its strengths

Who watches, when, and what they do next decides whether you need a 2D wall or a 3D twin.

CASE 01Group HQ

Eight plants, eight sets of reports, and a week of consolidation before the monthly review. Once the definitions are unified, every plant sits on one screen and a gap can be traced to a line on the spot.

Eight plantsPlant-to-plant comparison
CASE 02New plant showroom

For a customer visit, data argues better than a process walkthrough. The 3D plant is built from your drawings, status is live on screen, and the tour can follow the visitor route.

1:13D matches the floor
CASE 03Remote maintenance

An alarm means phoning around to find which machine and where. In the twin the alarm lands on the machine, and opening it shows the parameter curve and live video.

↓40%Time to locate a fault