SCADA · Data acquisition
No connected machines,
no digital plant
Multi-protocol gateways and mimic screens bring the PLCs, meters, robots and energy meters scattered along the line onto one platform. Data at second resolution, immediate alarms, history you can replay — old machines can join at a fraction of replacement cost.
SCADA · Acquisition and monitoring
No connected machines, no digital plant
Multi-protocol gateways and mimic screens bring the PLCs, meters, robots and energy meters scattered along the line onto one platform. Data at second resolution, immediate alarms, history you can replay — old machines can join at a fraction of replacement cost.
-
Multi-protocol acquisitionModbus / OPC UA / Siemens / Mitsubishi / MQTT, 20+ protocols
-
Mimic monitoringDrag-and-drop screens rebuild the line layout, without writing code
-
Live trends and replayReplay trends for any window, for incident review and process analysis
-
Tiered alarmsThresholds, time past limit and combined conditions, routed by shift and owner
-
History serviceSecond-level storage with a downsampled archive, plus a query API
-
Edge autonomyBuffers locally through an outage, back-fills on reconnect
The whole line fits on one screen
Key parameters grouped by station, values turning red and logging an event when they break the limit; trends replay any window for incident review.
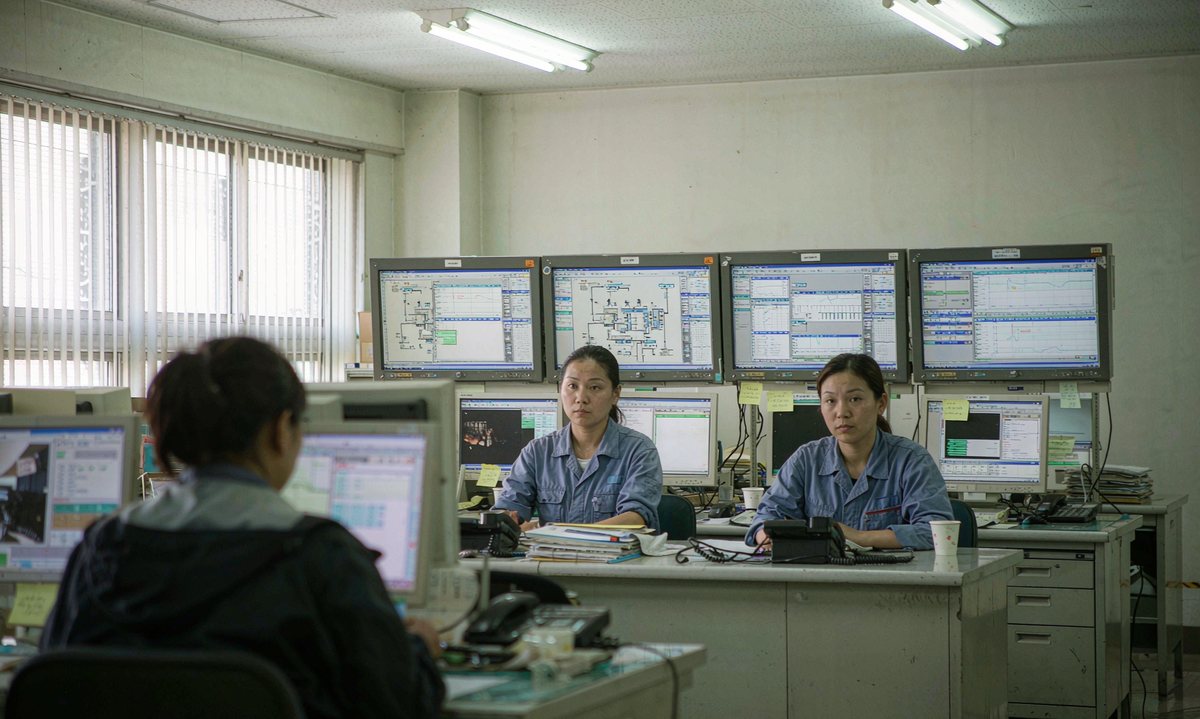
Illustrative render · AI-generated
Three common starting points
The same product lands differently in every plant. These are the three starting points we meet most often.
A fifteen-year-old machine has no network port, and replacing it costs too much. Add a gateway that reads the meters and PLC tags, and get the data first.
The power bill comes monthly and nobody can say which line eats it. Metering by line and key machine makes peaks and idle running obvious.
Failures are reported by hand and downtime reasons are remembered. Status and alarm events leave their own trail, so repairs can be traced.